Mastering Transactional Anomalies: A Hands-On Guide to Spotting and Solving Problems in Your Business


Motivation:
In this guide, you’ll learn how to get started with Anomaly Detection using Python, including:
What is Anamoly?
What are the challenges of Traditional methods to do Anamoly?
Using Isolation Forest for Anamoly Detection.
How to explain the results?
Problem and Requirements:
In finance Such as Banking, Ecommerce some users perform illegal transactions in the database and those transactions leave records in the database. However, this database is mostly composed of non-criminal transactions from the people who comply with the rules of the system they are part of.
Goal: To identify these Fraudulent Transactions using running our Database through an anomaly detection system.
Good news: Our database has all the records for identifying the crime.No needed for data gathering.
Bad news: Fraudulent transactions of the data are buried in millions of records and you might not recognise a fraudulent transaction in the records.
Challenges:
The need for automation mainly because the sheer size of the records makes the manual validation of the data to identify the anomaly is impossible to check all records.
If the problem is that the human experts dont have the time to go through the dataset can we try to automate their decision process?
Rule-Based approach - If experts could compile a set of rules for instance transactions that exceed a certain amount are anomalies or transactions of certain type X at a certain time Y is considered anomaly etc. Any type of clearly defined rule to single out a fraudulent transaction. With this rule, we can easily implement a system that can easily flag any anomalous transaction. That fulfil the rules of anamoly.
However, they are several problems with this approach. Coming up with a good set of rules require a lot of expertise and work rule needs to be validated and for the particular dataset at hand.
If the dataset format changes or a different dataset is used with different distributions the complete set of rules needs to be reworked to reflect the new situation.
Finally and most importantly it's impossible to predict all shapes and forms that anomalies can assume.
Solution to the above challenge:
To address this problem of the unknown nature of fraudulent transactions we can make use of data we have in the database. We have to build a system which learns from the data what constitutes an anomly.
We have to put the requirement that the model has to be unsupervised meaning that when we train this model we will not be able to tell which are anomaly or not. we don't have any information on that so far.
Machine Learning approach:
The first step we train an unsupervised model on our data to learn about
In the first step, we train an unsupervised model on our data to learn about the distribution of data and to get a sense of what an anamoly is in our context.
In step two we use this model to predict the likelihood of a transaction being fraudulent for every transaction using what it has learned in the above step.
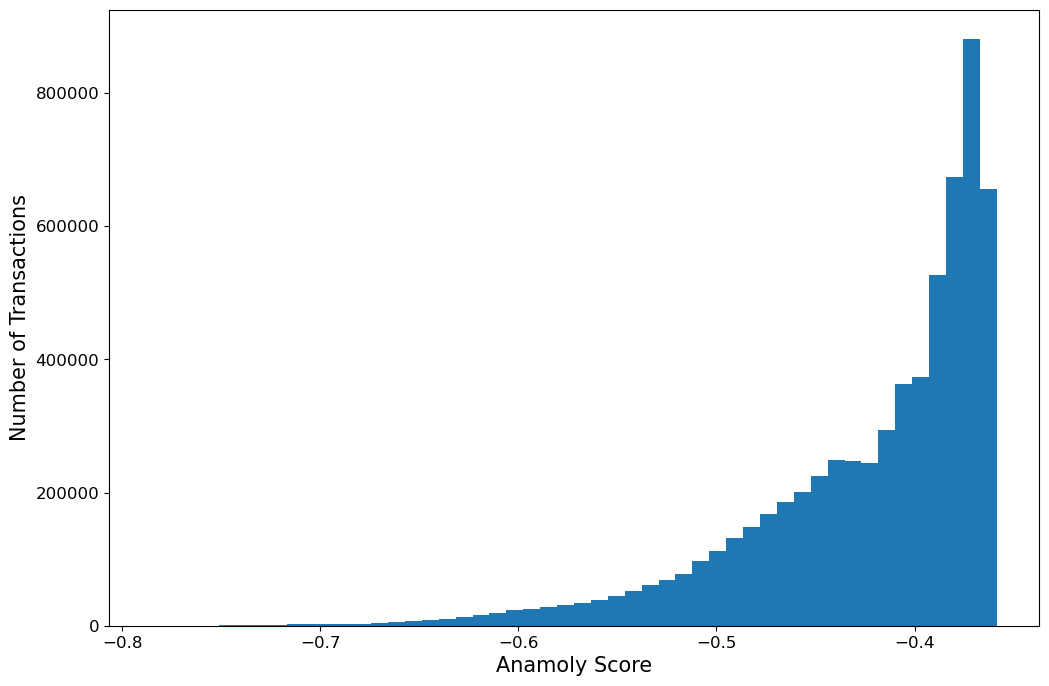
A machine learning model will never give a definitive answer of whether a transaction is anamoly their will be always an inheriant uncertanity in the answers it give us. If our model gives a continous value as anamoly score that refelcts the model certanity of the transaction likely to be anamoly we can choose ourself how wide we want to cast our net while looking for possible anamoly.
The output of the model will be a mapping of every transaction to certain a anamoly score. This score reflects how certain our model is of certain transaction as anamoly or not. If we want to consider some subset of transaction we have to set a threshold. the nature of anamoly will help us to consider how wider net we want to perform . Downside is we might not undestand why a transaction is anamoly .thats why we have explanability to the model to understand why model has flagged a certain transaction as anamoly.
Dataset:
import pandas as pd
import numpy as np
import matplotlib.pyplot as plt
from sklearn.ensemble import IsolationForest
from sklearn.metrics import f1_score, precision_score, recall_score, roc_curve
from sklearn.metrics import plot_precision_recall_curve, precision_recall_curve, roc_auc_score

from tqdm import tqdm
import shap
shap.initjs()
plt.rcParams["figure.figsize"] = (12,8)
data = pd.read_csv(r'C:\Users\MY\Desktop\Blogs\Fraud_Detection_Blog\PS_20174392719_1491204439457_log.csv')
data.head()
| step | type | amount | nameOrig | oldbalanceOrg | newbalanceOrig | nameDest | oldbalanceDest | newbalanceDest | isFraud | isFlaggedFraud | |
| 0 | 1 | PAYMENT | 9839.64 | C1231006815 | 170136.0 | 160296.36 | M1979787155 | 0.0 | 0.0 | 0 | 0 |
| 1 | 1 | PAYMENT | 1864.28 | C1666544295 | 21249.0 | 19384.72 | M2044282225 | 0.0 | 0.0 | 0 | 0 |
| 2 | 1 | TRANSFER | 181.00 | C1305486145 | 181.0 | 0.00 | C553264065 | 0.0 | 0.0 | 1 | 0 |
| 3 | 1 | CASH_OUT | 181.00 | C840083671 | 181.0 | 0.00 | C38997010 | 21182.0 | 0.0 | 1 | 0 |
| 4 | 1 | PAYMENT | 11668.14 | C2048537720 | 41554.0 | 29885.86 | M1230701703 | 0.0 | 0.0 | 0 | 0 |
About Data: step - maps a unit of time in the real world. In this case 1 step is 1 hour of time. Total steps 744 (30 days simulation). type - CASH-IN, CASH-OUT, DEBIT, PAYMENT and TRANSFER.
amount - amount of the transaction in local currency.
nameOrig - customer who started the transaction
oldbalanceOrg - initial balance before the transaction
newbalanceOrig - new balance after the transaction
nameDest - customer who is the recipient of the transaction
oldbalanceDest - initial balance recipient before the transaction. Note that there is not information for customers that start with M (Merchants).
newbalanceDest - new balance recipient after the transaction. Note that there is not information for customers that start with M (Merchants).
isFraud - This is the transactions made by the fraudulent agents inside the simulation. In this specific dataset the fraudulent behavior of the agents aims to profit by taking control or customers accounts and try to empty the funds by transferring to another account and then cashing out of the system.
isFlaggedFraud - The business model aims to control massive transfers from one account to another and flags illegal attempts. An illegal attempt in this dataset is an attempt to transfer more than 200.000 in a single transaction.
data['isFraud'].value_counts()/len(data)
0    0.998709
1    0.001291
Name: isFraud, dtype: float64
Feature Engineering:
features = pd.DataFrame(index = data.index)
numerical_columns = ['amount', 'oldbalanceOrg', 'newbalanceOrig', 'oldbalanceDest', 'newbalanceDest']
features[numerical_columns] = data[numerical_columns]
features['changebalanceOrig'] = features['newbalanceOrig'] - features['oldbalanceOrg']
features['changebalanceDest'] = features['newbalanceDest'] - features['oldbalanceDest']
features['hour'] = data['step'] % 24
type_one_hot = pd.get_dummies(data['type'])
features = pd.concat([features, type_one_hot], axis=1)
Isolation Forest:
Model:
from sklearn.ensemble import IsolationForest

forest = IsolationForest(random_state = 0)
forest.fit(features)
IsolationForest(random_state=0)
scores = forest.score_samples(features)
plt.hist(scores,bins =50)
plt.ylabel('Number of Transactions',fontsize = 15)
plt.xlabel('Anamoly Score',fontsize = 15)
plt.xticks(fontsize = 12)
plt.yticks(fontsize = 12)
Top Outliers:
top_n_outliers = 5
top_n_outlier_indices = np.argpartition(scores, top_n_outliers)[:top_n_outliers].tolist()
top_outlier_entries = data.iloc[top_n_outlier_indices, :]
top_outlier_features = features.iloc[top_n_outlier_indices, :]
top_outlier_features
| amount | oldbalanceOrg | newbalanceOrig | oldbalanceDest | newbalanceDest | changebalanceOrig | changebalanceDest | hour | CASH_IN | CASH_OUT | DEBIT | PAYMENT | TRANSFER | |
| 4157895 | 37387628.10 | 862621.88 | 0.0 | 37843025.59 | 7.523065e+07 | -862621.88 | 37387628.10 | 15 | 0 | 0 | 0 | 0 | 1 |
| 4146715 | 38874009.46 | 435622.96 | 0.0 | 73634878.73 | 1.125089e+08 | -435622.96 | 38874009.45 | 15 | 0 | 0 | 0 | 0 | 1 |
| 4153782 | 32572996.87 | 279467.23 | 0.0 | 84947676.90 | 1.175207e+08 | -279467.23 | 32572996.87 | 15 | 0 | 0 | 0 | 0 | 1 |
| 4142016 | 51141938.17 | 310058.79 | 0.0 | 87081824.45 | 1.382238e+08 | -310058.79 | 51141938.17 | 15 | 0 | 0 | 0 | 0 | 1 |
| 4145988 | 31866120.39 | 503019.94 | 0.0 | 63539675.65 | 9.540580e+07 | -503019.94 | 31866120.39 | 15 | 0 | 0 | 0 | 0 | 1 |
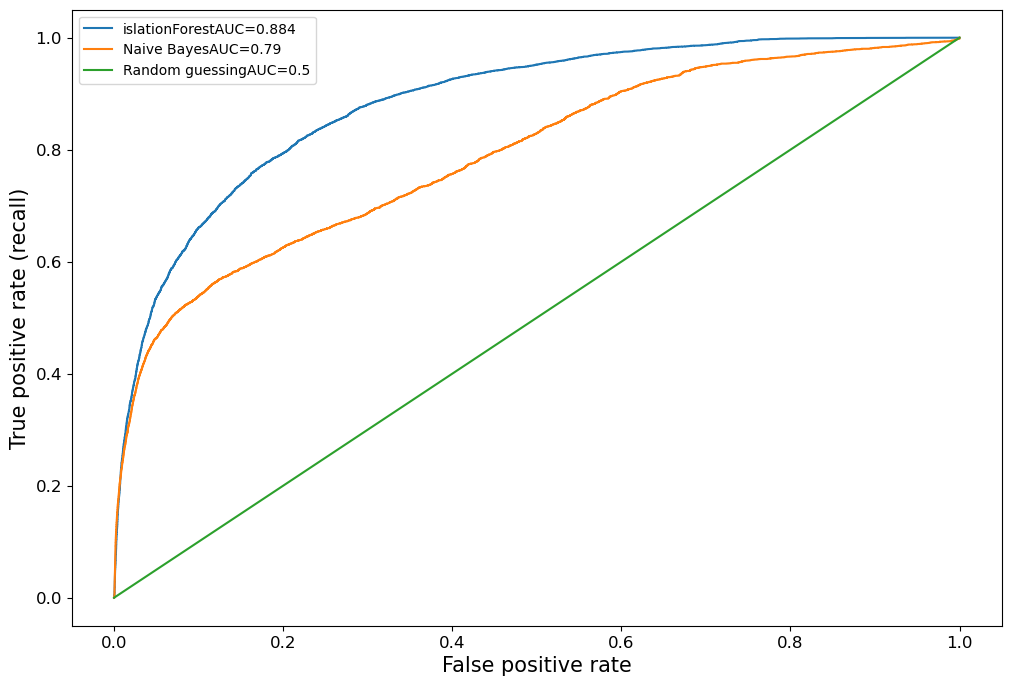
## Isolation forest anamoly score
fpr_forest,tpr_forest,threshold_forest = roc_curve(data['isFraud'],-scores)
auc_score_forest = roc_auc_score(data['isFraud'],-scores)

## Naive Bayes Anamoly Score
fpr_naive,tpr_naive,threshold_naive =  roc_curve(data['isFraud'], data['amount'])
auc_score_naive = roc_auc_score(data['isFraud'],data['amount'])
def plot_roc_curve(fpr,tpr,name,auc_score):
  plt.plot(fpr,tpr,label = name+'AUC={}'.format(round(auc_score,3)))
Results:
plot_roc_curve(fpr_forest,tpr_forest,'islationForest',auc_score_forest)
plot_roc_curve(fpr_naive,tpr_naive,'Naive Bayes',auc_score_naive)
plot_roc_curve([0, 1], [0, 1], 'Random guessing', 0.5)
plt.xlabel('False positive rate', fontsize=15)
plt.ylabel('True positive rate (recall)', fontsize=15)
plt.xticks(fontsize=12)
plt.yticks(fontsize=12)
plt.legend(prop={'size': 12})
plt.legend()
<matplotlib.legend.Legend at 0x22633a36ac0>
Explanability:
 import shap
explainer = shap.TreeExplainer(forest)
random_indices = np.random.choice(len(features),5000)
shap_values_random = explainer.shap_values(features.iloc[random_indices,:])
random_features = features.iloc[random_indices,:]
Explanation for local points
shap.initjs()
shap.force_plot(explainer.expected_value, shap_values_random[1, :], random_features.iloc[1, :])
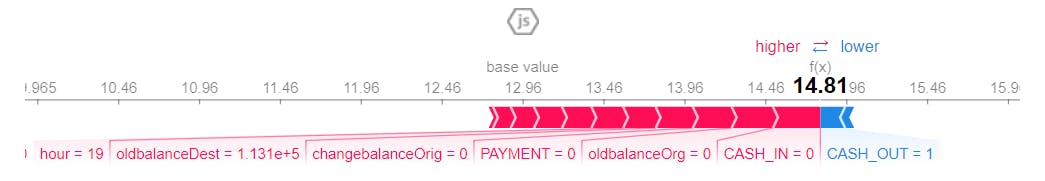
The above plot shows how the individual features of the data point contributed to shifting the model output from its expected to base value. These contributing values are called SHAP values. Blue values are contributing to lower the anamoly score and the red values for higher anamoly score.
For the above entry features such as amount(higher amount) is suggestive that the data is anamolous.
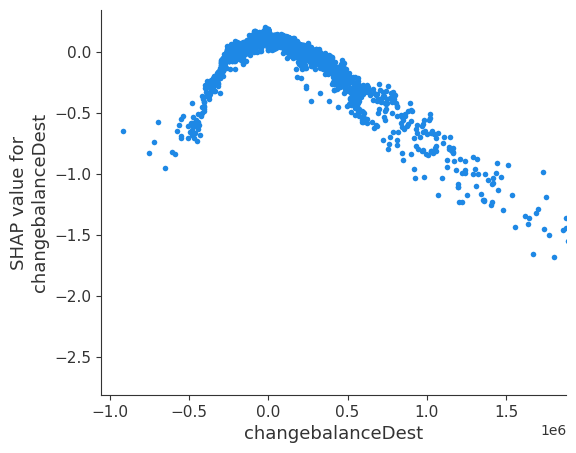
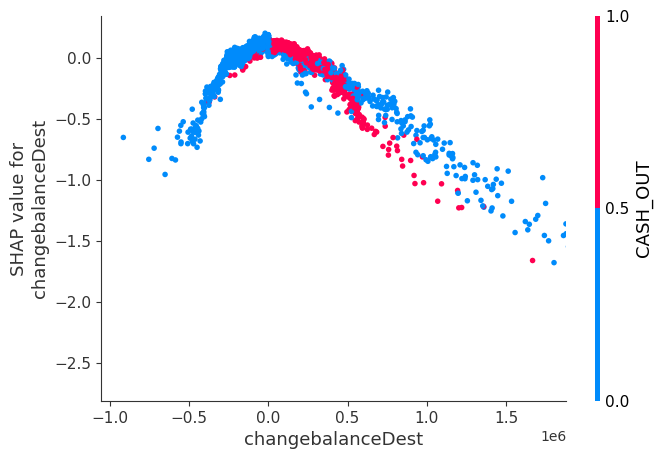
SHAP values are local explanations of different features for a given data point. To gain the global trends by aggregating the local explanations.
SHAP library has a library called dependence plot which shows us how mulitple datapoints of shap value depend on the feature .
shap.dependence_plot('changebalanceDest',shap_values_random,random_features,interaction_index= None,
                    xmax= 'percentile(99)')
shap.dependence_plot(
 'changebalanceDest',
 shap_values_random,
 random_features,
 interaction_index='CASH_OUT',
 xmax='percentile(99)'
)
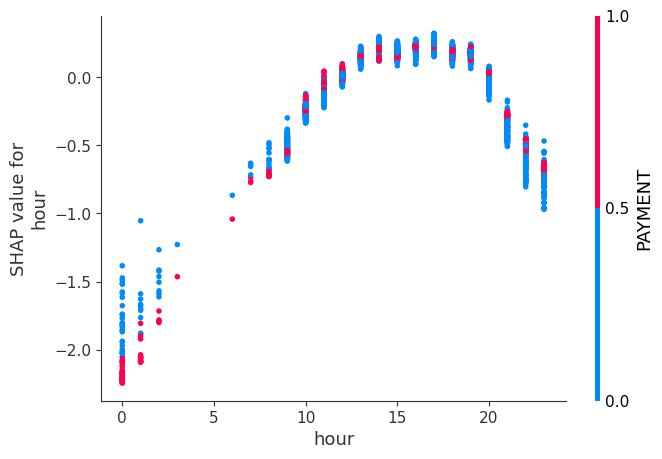
shap.dependence_plot(
 'hour',
 shap_values_random,
 random_features,
 interaction_index='PAYMENT',
 xmax='percentile(99)'
)
Conclusion:
The above guide demonstrates how to get started with Anomaly Detection using Python and the Isolation Forest algorithm. The guide explains the challenges of traditional methods for anomaly detection, such as rule-based approaches, and provides a solution to these challenges by using a machine learning approach. The guide uses the Isolation Forest algorithm to train a model on the data and predict the likelihood of a transaction being fraudulent based on the learned information. The guide also explains how to evaluate the results and provides code for visualizing the results using SHAP. The conclusion of the guide is that using a machine learning approach, specifically the Isolation Forest algorithm, can effectively identify fraudulent transactions in large datasets and provide a certain level of certainty in its predictions.